flutter_performance_monitor_plus 0.0.3  flutter_performance_monitor_plus: ^0.0.3 copied to clipboard
Flutter in-app performance monitor overlay: live FPS, jank, build/raster times, rebuilds, memory, CPU, and network logging via draggable bubble.
flutter_performance_monitor_plus #
In-app performance monitor overlay for Flutter. See FPS, frame times, rebuilds, memory (best-effort), CPU, and network requests without leaving your app.
Why #
- Spot jank early with live FPS/build/raster timing overlays.
- Track rebuild churn, memory, and CPU in debug/profile without opening DevTools.
- Capture HTTP traffic automatically (or log manually) alongside UI performance.
Features #
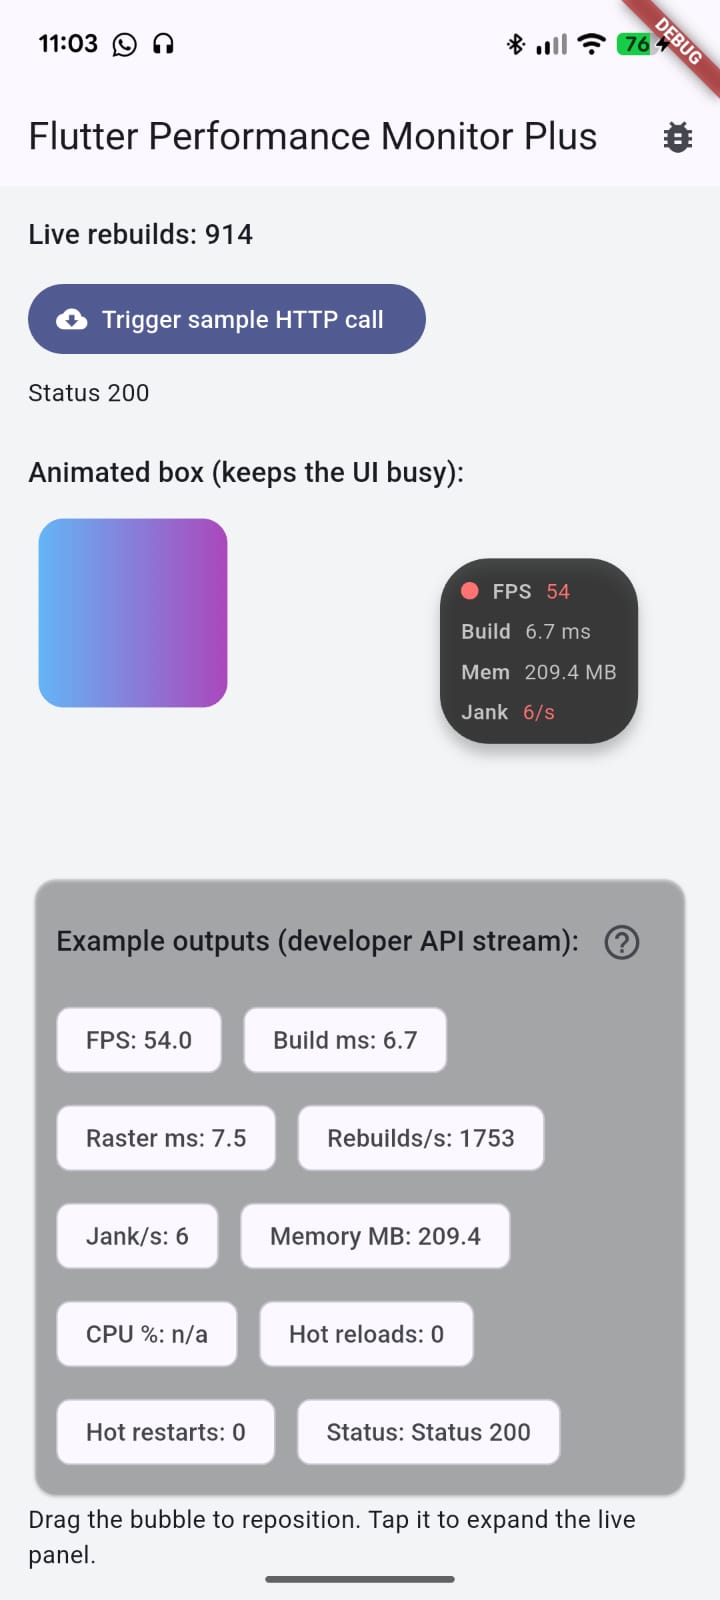
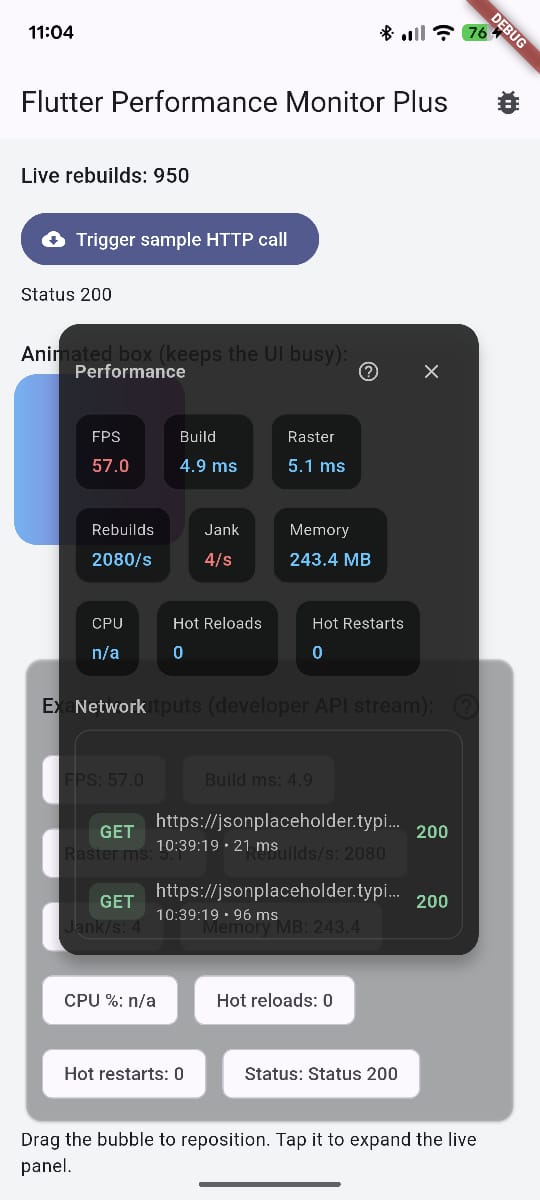
- Draggable bubble with quick stats; tap to expand a detailed panel.
- Double-tap the bubble to dock it to the screen edge (peek handle); tap handle to reveal.
- Long-press bubble or peek handle to open the Flutter performance metrics guide.
- FPS, build/raster times, rebuilds/sec, jank/sec, memory (VM RSS), CPU%, hot reload/restat counters.
- Network logging via
MonitoredHttpClientor manual logs. - Pure Dart/Flutter; works on Android, iOS, web, and desktop.
Install #
Add to pubspec.yaml:
dependencies:
  flutter_performance_monitor_plus: ^0.0.1
Usage #
Wrap your app:
void main() {
  runApp(
    PerformanceMonitorPlus(
      config: const PerformanceMonitorConfig(
        enableNetworkLogging: true,
        expandedByDefault: false,
      ),
      child: const MyApp(),
    ),
  );
}
Attach later to an existing Overlay:
final handle = PerformanceMonitorPlus.attach(
  context,
  config: const PerformanceMonitorConfig(
    overlayPosition: PerformanceOverlayPosition.bottomLeft,
  ),
);
// Call handle.detach() to remove and dispose.
Log network calls with the bundled client:
final client = MonitoredHttpClient();
final response = await client.get(Uri.parse('https://jsonplaceholder.typicode.com/todos/1'));
Or log manually:
PerformanceMonitorPlus.logNetworkRequest(
  method: 'CUSTOM',
  url: 'app://local/step',
  duration: const Duration(milliseconds: 40),
  statusCode: 200,
);
Gestures (bubble) #
- Tap: expand/collapse panel.
- Double-tap: dock to nearest screen edge; tap handle to reveal.
- Long-press: open performance metrics docs (external browser).
- Drag: reposition; releasing snaps back to normal state.
Config options #
const PerformanceMonitorConfig(
  enableFps: true,
  enableFrameTime: true,
  enableRebuildsCount: true,
  enableMemory: true,
  enableNetworkLogging: true,
  overlayPosition: PerformanceOverlayPosition.topRight,
  overlayOpacity: 0.95,
  expandedByDefault: false,
  maxNetworkEntries: 50,
  mode: PerformanceMonitorMode.visible, // hidden keeps collectors running
  theme: PerformanceMonitorThemeData.dark(), // or light() / custom
);
Notes & limits #
- Rebuild counts rely on
debugOnRebuildDirtyWidget; they update in debug/profile. - Memory uses
ProcessInfo.currentRsswhen available; web targets shown/a. - CPU is best-effort and may be
nullon some platforms.
Example app #
cd example
flutter run
The sample app shows FPS/rebuild churn via animation, a sample HTTP call, the overlay bubble/panel, and the metrics help link.
Screenshots #
Animated demo (GIF):

Collapsed bubble (peek/edge dock):
Expanded panel:
Metadata
Publisher
Weekly Downloads
Metadata
Flutter in-app performance monitor overlay: live FPS, jank, build/raster times, rebuilds, memory, CPU, and network logging via draggable bubble.
Repository (GitHub)
View/report issues
Topics
#performance #monitoring #overlay #diagnostics #network
Documentation
License
![]() MIT (license)
MIT (license)